Using enzyme extinction curves to plot Km and Vmax - (Oct/05/2006 )
Hi, I am new to molecular biology and want to ask advice on this subject.
I have an enzyme assay where, once I give the enzyme mixture the substrate, a colour change can be observed at Xnm giving a negative slope. I have absolutely no idea how to use this slope to calculate Km, Vmax etc. I have checked the web, but all I can find is plots of product vs time?
ANy help would be much appreciated.
cheers
Graham
Hi! Its not easy to explain this, but I hope I can help...
If I got the right idea, what you've got is a graphic Abs vs time, right?
First of all, you need to do the assay for different substrate concentrations, at least three, but five would be better.
Considering three:
For each assay you need to find "m", the slope, in the inicial linear phase of the Abs vs time graphic. "m" corresponds to the initial velocity of the reaction, "Vo", so you end up having, for each substrate concentration, a different velocity, or rate: ([S1], Vo1), ([S2], Vo2), ([S3], Vo3).
Now with this data, you can easily find Km and Vmax, according to the Michaelis-Menten  or Lineweaver-Burk
 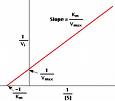 models (attachments).
Hope it helped. 
I have an enzyme assay where, once I give the enzyme mixture the substrate, a colour change can be observed at Xnm giving a negative slope. I have absolutely no idea how to use this slope to calculate Km, Vmax etc. I have checked the web, but all I can find is plots of product vs time?
ANy help would be much appreciated.
cheers
Graham
the best is to use a fitting program (Sigmaplot, Grafit, Graphpad and others) were you simply put in your data and program will plot and numerically determine Km and Vmax; normally, Lineweaver-Burk plotting is optionally integrated