| |
Top : Imaging Techniques : Blood Vessel Dihydroethidium (DHE) Quantification Using Image J
Blood Vessel Dihydroethidium (DHE) Quantification Using Image J | |
| Author: Wei Ni | |
| Affiliation: Diabetes Center at UCSF | |
| Source: Protocol Online | |
| Date Added: Wed Feb 01 2012 | |
| Date Modified: Wed Feb 01 2012 | |
| Abstract: A detailed protocol for DHE signal quantification on blood vessel samples using Image J. | |
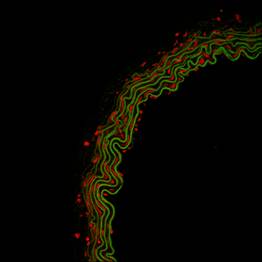
I use Leica TCS SP5 Confocal Microscope for imaging, red channel for DHE signaling (pay attention to the special excitation and emission parameters) and green channel for collagen auto-fluorescence (I used the default setting for Alexa 488). Here is an example of DHE staining on mouse aorta.
Procedure
- Open image in Image J.
- Go to Image→Color→Split Channel. You will get three images in gray scale
showing signals in red (image 1), green (image 2) or blue channel. I don’t
have anything in blue channel, so just ignore the split result in blue
channel. As you will see, I do have auto-fluorescent signal in the red
channel, which was not showing obviously in the overlay. This is why I do
not recommend only capture DHE signal and use the “measure” function, which
will count both DHE signal and auto-fluorescent signal. (There is an
exception. If you have super strong signal, you could use very low exposure
time to avoid capturing the auto-fluorescent signal.)
- Go to Process→Image Calculator. Subtract the image green (image 2) from image red (image 1).
- If the intensities of auto florescence are similar in these two
channels, you will get rid off the auto fluorescence in red channel in the
result (a new image will pop up, image 3). If you still have auto fluoresce
in the result, just simply do the subtraction again. Make sure you do
everything the same for images in all groups.
- Now we are ready to count the intensively of DHE signal. Click the result image (image 3), Go to Analyze → Measure, you will get integrated intensity for DHE signal.
- You may notice, when you take images, the amount of blood vessel in each image may be different. For normalization, I count the area of auto fluorescence to represent the sample size in the image using image 2. Click image 2, go to Process→ Binary→ Make Binary (image 4). The binary step takes out the intensity variation of auto fluorescence in each image. Now, click image 4, Go to Analyze → Measure. Use the integrated intensity (represents area of auto fluorescence) for normalization.
- Calculate DHE signal / auto fluorescence signal ratio and compare each group.
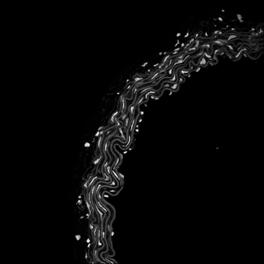
Image 1
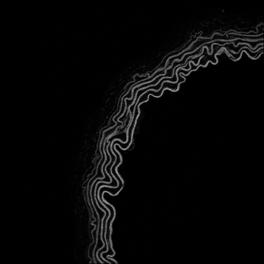
Image 2

Image 3
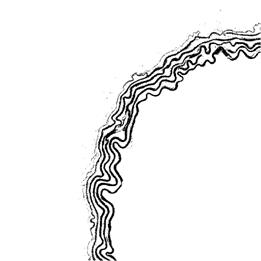
Image 4