how to combine several flow cytometry histogram figures? - (Aug/27/2009 )
I did cell cycle synchronization and got wonderful histogram figures of different cell cycle phases. In most published papers the figure is combined histogram figures in Three-dimensional as attached picture. Does anyone know to make it? I guess I need some special software. who can tell me what is the name of this software?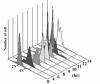
You can't do that in excel? I was pretty sure you could. ... In any case, I know for a fact you can do it in GraphPad Prism. My girlfriend uses it and she LOVES it. It's pretty easy to use, too.
Cheers,
-Carlton
You can do it in excel using the transparent tool 
Hi,
Some of the standard acquisition programs of a flow cytometer allow such displays. For example all versions of CellQuest and CellQuest Pro from BD allow it (FACScan to FACS Calibur or Vantage). I am not sure about current Beckman Coulter programs, but their old acquisition programs (like Expo) allowed it too, so I guess their new protocols didn't degenerate in this aspect. Although BD did so. Their latest universal program FACS DiVa forgot this nice feature of its ancestors.
If you have some of the a.m. software and you need some more info about how to do it, let me know.
Regards
Jochen