What went wrong in my qPCR? - please look at the dissociation curve (Feb/19/2009 )
Hi all,
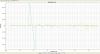
I am a newbie to qPCR.. I did a couple of runs of qPCR. I used the power SYBR green kit from applied biosystems, and used pre designed primers. I did have a bit of contamination in a few samples (checked it with my RT- samples). I am sorting out other issues. For now, please have a look at my dissociation curve, people find it very weird but none has an idea why this would be happen. Can anybody please help me trouble shoot this problem!!??!! pleeeeeeease!!!!!!!!! 
The dissociation curve does look weird. Have you run a regular PCR with the primers and your samples? That may give you an idea what is wrong.
Hi all,
Sorry I figured out why it looked very weird.... I did not omit the empty well during analysis... now that I did it, my melting curve still looks weird, but better than before. can you please pour ur suggestions as to why it still looks weird?? please!!!!!!!!! thanks...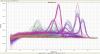
A bit overloaded with information, your little picture. Maybe you can toggle of a few samples. Anyway it looks like you have a lot of background fluorescence and primer dimers.
I agree. have you done the titration curves to determine reaction efficiency?
I never trusted plate based real-time from the beginning. I would still go for the rotor based machines like Light Cycler 2 or RotorGene 6000
I've had quite a bit of luck with it in the past, but getting your conditions squared away in the beginning can be a real nightmare.
Curtis on Feb 26 2009, 09:40 AM said:
I know, light cyler or rotorgene is really good and effective.. but our very poor labs have just this plate based systems....!!
aimikins on Feb 25 2009, 10:21 AM said:
titration curves?? can u please elaborate on how to do that or give me a link which will help me understand the procedure better.... thanks....
Thanks for the response guys...
For now, I am testing my primers on human genomic DNA, hopefully the bands r on the right spot and please god please, no primer dimers!!!!!!!!!!!!!!
PS: I got my primers from the literature, they used these primers in taqman, but I just got the sequences and am using it for SYBR green, did a BLAST search and it returned with just my gene of interest.. Should this be ok???????