The curve of sample one is ideal or not - (Mar/09/2017 )
This two curves for two samples HCV analysis and the instrument read the same CT 35.5 for the two samples. I want to know why the background noise increased in sample one and fluorescence is small in this sample in comparison with the second sample that have ideal curve and fluorescence.
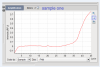
I can't speak about the level of fluoresence, other than it might be inter-run variability. The noise, on the other hand, is a consequence of the limited fluorescence level. As the scale at which you are looking at the second plot is greater, it smooths out the noise - if you zoom in on the second plot to a scale similar to plot one, you will likely see similar noise. An analogy might be; if you were flying in a plane looking down at some fields - from the air they would look smooth, but walking on the land you would notice small rises and dips that are not apparent from the height at which you were flying.