multiple melting curves - (Oct/07/2016 )
Hello, could somebody help me with qPCR results.
I am tiring to analyze TNFa level in my samples. I have multiple melting curves in my sample (with TNFa not with ActB).I did a agarose gel (1.8%) which showed only major peaks in some samples (included the pics 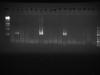
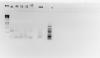 ).
).
Standard curve with sample cDNA and TNFa primer seemed OK, but i do have two melting curves in my NTC (primer dimers?) and I do get high Ct values with my samples (25-36 with TNFa, 22-26 with ActB) and this can be problem. Should I redesign new primers?
The main problem is that I get multiple melting curves and I do not know why, can it be amplification from gDNA? I do not belive it contamination because I think I would see more peaks in gel with NTC sample and all the ActB samples are OK (only one high peak)
If you are getting multiple peaks in your melt curves, you are getting more than one product, one of which might be primer-dimer. Did you design your own primers or use primers from a publication? What size product should you be getting? Your bands look a bit like doublets but they are so smeary it is hard to tell.
Probably you could benefit from redesigning the primers, optimizing the reactions to get single bands, or both. You could be amplifying from gDNA if you did not design your primers on either side of an intron in the genome. Also, a big secret here- primer-dimers can usually be reduced/eliminated just by reducing the amount of primer you put in the reaction. Sometimes less is more-really!
Sorry this answer is late, but maybe it will help someone else!