MSP_Primer dimers? - (Apr/08/2015 )
Dear All,
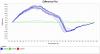
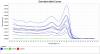
I'm trying to establish a method to detect methylation in the NR3C1 gene but I detect an additional peak in the melt profile. I thought about primer dimers, but I'm not sure that is it the problem. Indeed, the "high" of the additional peak is proportional to the real peak (which depend on how much methylated the sequence is).
I attach the file with the melt curves.
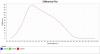
The difference plot also doesn't look very nice (attached).
One of the primer is ACCTAATCTCTCTAAAACGACGTTAA. I think it could be prone to hairpins or self hybridization.? Could I slightly modify it?
Thank you very much for any possible advise!
Elena
You should run the samples out on an agarose gel. Have you optimized your annealing temperatures or MgCl? Also, I am assuming your amplicons are larger than 100bp so you should be able to differentiate them from a primer dimer. If you are still unsure about the status of this amplicon and it is a single band on on a gel then you can gel purify and sequence it.
Secondly, have you fully characterized DNA methylation at the NR3C1 promoter to determine which CpG are differentially methylated? Or has someone characterized it in the literature? If you have not, MSP is not very informative. Furthermore, I would perform bisulfite clonal sequencing or pyrosequencing in conjunction with RT-qPCR for mRNA expression.
Thank you very much for you helpful answer. I just saw your answer now.
Yes, the first step is to run an agarose gel. Then I could purify it from the gel and run the HRM after it (and compare the methylation level with the one previously obtained). Something I didn't say before: I don't detect any peak in my blank control, which is strange since I should detect it in case of primer dimers.
The temperature doesn't make any difference, I always detect this second peak.
I didn't try to change the MgCl concentration because I'm using the Melt Doc mix (applied biosystem) that already contain MgCl. But I could try to add MgCl (?).
My amplicon contains 8 CpG that have been described in the literature as differentially methylated and 8 for which I have no informations.
Thanks again,
Best regards,
Elena
The messy melt profiles suggest you have inefficient bisulfite conversion and primers that are not directed to fully converted DNA strands. You are amplifying a mixture of incompletely converted templates and therefore you have that messy melt profile.
Best way to resolve this is to revisit your primer design, we know bisulfite is not 100% efficient. But designing primers that specifically amplify fully converted DNA in your sample will help with the melt profile.
Nick
Thank you Nick.
In the gel electrophoresis I see no primer dimers but a shadow of a second band at 300 pb (my sequence is 200 pb), so I will try to slightly modify the primers. I will have a CG more, maybe that will improve the specificity.
Elena
Hi Elena, by Gel Electrophoresis, you would only see one band of expected size if it is high enough resolution, you may see a thicker band at the expected size because if you have enough base differences within your amplicon of interest, because of inefficient bisulfite conversion, this could be seen as 1-5bp difference.
good luck
Nick
ok, I see, that's a problem and I will try to design new primers. Concerning my second peak in the melt curves profile, could be the data collection a problem? I settled the data collection at the beginning of the HRM (60°C), at the end (95°C) and also in between. Could this first peak be the result of the data collection settlement?
Thanks,
Elena
no it is not a data collection problem and more likely to be a conversion artefact problem given that the primers and/or bisulfite conversion are not efficient to give rise to multiple species of amplicons.
Cheers
Nick
Hallo,
I see, is not a data collection problem.
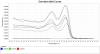
I modified the primers (they are longer). With one of them modified I have less the problem of the second peak but the melt profile is messy, and with the other one, I have a clean melt profile, but still the two peaks (pictures attached). It is not a problem of primer dimers, since I don't see any residus when running the gel.
I don't really understand why a product of 300 pb (which I saw on the gel) melt before my product of 200 pb, and why this two peaks are always proportional?
Otherwise the primer works, in the sense that it detect until 0.1% of methylation and it don't amplify the unmethylated sequences.
Thank you very much for any feed-back or suggestion!!!
Elena
Hi Elena,
great to hear your experiments are working more efficiently now, with regard to the melt profiles, this is indicative of differential DNA methylation. So the two peaks may represent fully methylated and fully unmethylated templates, the messiness would be varying methylation levels in between.
Good luck!
Nick