qPCR normalization - (Mar/08/2015 )
Hello all.
Am new in qPCR and recently i tried to normalize my experiments using SYBR Green in the CFX 96 Bio-rad
Everything looks relatively normal i,e., E, the slope. However my y intercept value is too low and amplification curves do not have a decent sigmoidal shapes.
My questions are:
How does the software calculate the y intercept? is it based on the starting concentration (the value we put during exp. setup) or what it gets from results.
Another question concerns the shape of my curves, the highest concentrations reaches the plateau phase very earlier which should not be especially in the case of serial dilutions.
I run 7 serial dilutions(1/4) and they look very distinguishable on the gel.

Y intercept and slope are calculated from the ct value vs the starting input you enter during setup for each standard. Y = mx + b. I would worry mostly about your slope, -3.33 being perfect or 100% efficiency. I try to have an efficiency of 85-100%. Make sure the efficiencies are similar for the primers you are making comparisons with.
The highest standard (10^10 or 9) can have a less than ideal curve. I am assuming the ct value for this std is around 3-6? It's difficult for the software to get good background subtraction and baseline setting for such a high standard because the subtraction/baseline correction is based on the first few cycles. I wouldn't be to concerned about the highest standard as long as the others look good. I am not able to open your file on my iPad so not sure what your curves look like.
Hope this helps.
Thank you for the reply,
The results are in MS word, that is why you cannot open them.
Anyway my E= 102% and slope is -3.27 which is relatively fine according to me. However the y=15
I think this is due to the values put during exp. setup.
Could you please check on the shape of my curves
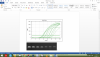
Your curves look fine. They are smooth. The highest standard does saturate early but that is fine. Are these 10 fold dilutions for your standards? You should see about a 3 cycle difference between standards. I would also extend my lowest standard. Make sure your unknowns fall between the highest and lowest standards. It's also easier to set your threshold when you view your curves in log view setting.
Thank you very much, they are 4 fold dilutions and i think i should make 10 fold dilutions.
Again I will try to search on how and why to adjust the threshold.
Regards
Steven