Poor efficiency standard curve - (Sep/04/2013 )
Hello all,
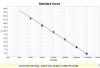
I have questions about standard curve for absolute quantification. I've already ran 2 times for this target gene, but I don't have any idea why the Ct between dilutions couldn't reach 3.3. From the picture I attached (please ignore Ct below 15), Ct between dilution almost reach 5 cycles! I almost sure it's not because of the pipetting (1:10 dilution, 2 ul template and 18 ul sterile ddH2O). Any chance primers caused it? Or any other aspects affecting the efficiency? I use 300 nM final conc. for each primers and 0.5 ng cDNA for 10 ul pcr final volume. I ran the housekeeping gene (the same method as this target gene), and the result is better (the slope -3.5).
Any responds will be appreciated. Thank you :)
Cheers,
dee
Why don't you try different dilution? I was trying 1:10, 1:5 and 1:2 and the best was 1:5 (for me).
So maybe that could help.
Regards.
Dear
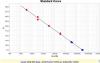
thanks for the response! Yes I've tried 1:5 dilution and increasing each primer to 500 nM final concentration, and the result is better. Looks like I haven't optimized the reaction well before.
Thank you once again.
Cheers,
dee