HPLC method for mouse creatinine measurements in a diabetes type 1 model - (Jul/11/2013 )
Hi all.
I need some with some calculations.
I´m currently developing a method for measuring creatinine in mice with HPLC. For this are using a Agilent Zorbax SRC300, 2.1mm x 50 mm, 5u strong cation column and a 5mM sodium acetate pH 4.1 solvent.
We emply a 2-fold creatinine standard (128 uM - 0.5 uM) to interpolate the unknown serum creatinine concentrations from.
Samples are prepped with AcN (Acetonitrile) to precipitate proteins before running onto the column.
We use:
100 ul AcN
15 ul serum
spin 10000 rpm, 10 min
remove supernatant: 90 ul to new epp.tube for SpeedVac (try samples)
Resuspend tried creatinine in 15 ul HPLC solvent
Load 3 ul to each run in HPLC.
Average creatinine levels are 18.29 umol/L (0.207 mg/dl)
I get around 7.395 uM when interpolating in my graph!!
Is there something I´m missing ?? dilution factor? How do I get uM to umol/L
Thanks
you are drying only ~78% of your sample. do you account for that in your calculations.
have you tried spiking the samples to determine recovery?
uM is umol/L
No.. I have not yet tried spiking, but it is a good idea.
Thanks.
Although, I don´t think it will make up for at difference I see, that I may loose some creatinine in the process.
I´m hoping, but...
Could it be my standard curve that I use for interpolating ? It has an r squared at around 0.97...
Also, the samples are prepped as described in the first post, but the standards are not... I know this is an error, and I have to do this, but could this make up for the lower measured amounts?
Is there anything else I should try??
Thanks very much
r2=0.97 is not too bad for your standard curve.
not treating your standards as you treat your samples can make a significant difference but you may not be able to treat them in the exact same way unless you have serum that is completely deficient in creatinine. try treating them as similarly as possible.
spiking samples with creatinine will give you an idea about recovery.
you can also spike samples and standards with something else so that you can normalize them.
Thanks all.
But the acetonitrile is not suppose to precipitate creatinine, but only the proteins in the solution.
However, I have just tried running prepped and non-prepped samples in the same run to investigate this difference.
I used std. samples ranging from 128 - 64 - 32 - 16 - 8 - 4 - 2 - 1 - 0.5 uM.
And... I do not see a significant difference between the prep. vs. non-prep. in both the elution peak or the area under the curve after integration.
However... I do sometimes (every time actually) see inconsistencies in the dilutions.
Normally I see an area under the curve for the 128 uM at 120000 μV*sec and thus around 60000 for 64 uM and 30000 for 32 uM.
But sometimes, and especially at the lower conc. I observe significant higher area under the curve (2 - 1 - 0.5 uM)
And also sometimes for the 64 - 32 - 16 uM concentrations.
What is up with this? What is going on here? I don´t get it!!
Especially with the non-prep. samples where I just load a simple dilution of a stock solution.
Please help with this....
Thanks
how is your baseline?
what are your peak heights? width?
have you adjusted the integration start and stop so that they are consistent?
can you show a typical chromatogram?
My baseline is 0.0000 AU (+/- 0.00005)
my peak heights varies with the creatinine concentrations of course, but for 128 uM it is 0.0075 AU in one run to 0.0060 AU i another.
The integration start and stop is adjusted so that they are consistent yes.
I will attach a typical chromatogram
the baseline looks very smooth and the peak looks mostly symmetrical (tailing off towards the end as is typical in hplc). i'm guessing that this is a standard and not a serum sample.
you'll note the little blip near the end of the integrated portion of the peak. the tailing and blip will add area to the peak. this may be the cause of the deviation from ideal of your standard curve. a possible remedy for this may be to start and stop integration a little above the baseline, at points where you eliminate the tail (not sure how well this will work with real samples).
6mAU (.0060AU) and 7.5mAU can be considered nearly identical (depending on the sensitivity of the detector, the stability of the baseline, the purity of the sample, etc).
do you run samples and standards in triplicate and take an average for each point and sample? if so, is there significant deviation from the average?
can you show a plot of a typical standard curve? it's possible that it isn't truly linear, at least not early.
have you attempted a standard curve with spiked serum?
I run the samples in duplicates, and there are fine (largest SD is 6%, and the smallest at 0.16%
Spiked serum??
Does you mean a serum sample spiked with a given std. concentration?
Two attached pictures of std.curves (I still don´t know if I´m suppose to use linear regression or non-linear regression...
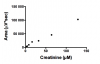
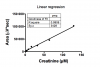
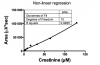
Thanks
yes, that's what i mean by spiked serum. although i would recommend the entire standard curve be done with spiked serum (use the "0" concentration as a subtractive blank) so that you can account for the influence of neighboring peaks. it may also account for the recovery after precipitation (unless spiked after precipitation, you could do it both ways to determine recovery efficiency).
how reproducible are those concentration points in the standard curve? if they are then it would appear to be at least bi-modal and not necessarily linear.