qPCR [template] and [primer] troubleshooting...... - (Jan/09/2013 )
Hi all,
So recently I've been graced with the opportunity to start learning and troubleshooting qPCRs for the first time, and sadly I'm having some issues to wade through before I start even attempting my full experiments.
First off, I'm using the Power SYBR Green 2x mastermix from Applied Biosystems. This also contains the passive reference dye, ROX. Before I even joined the lab I'm in, RNA samples were isolated and primer stocks (ordered online) were diluted in millipore water and stored at -20. To be honest I wish they had been stored in nuclease free water or at least autoclaved millipore water to begin with. The RNA samples - I'm not sure what they were stored in, but I retrieved them from -80.
I performed the RT reaction to all samples, but I've only been performing very simple qPCR experiments with two templates - basically four rxns testing template and primer concentrations, one -RT control, and one no template control (NTC). I haven't been doing triplicates and am not about to do a full scale primer optimization experiment because I sadly don't have enough mastermix to experiment with. Also at the beginning of my troubleshooting the NanoDrop was down, so all I did was a generic 8x dilution on cDNA and that's what I've been using for the first few rxns. Also, I inadvertently was using 150uM primers when I had intended to use 150nM to start with.
The strange part is that I got very nice amplification curves when I had the massive amount of primer in my reactions, however logically my results did not make sense - the rxns with the most amount of starting template were reaching threshhold Ct slower than those that had lower amounts of starting template - and this relationship was conserved throughout my rxns, until I figured out my miscalculation of my primers. Thinking I had figured out a possible reason as to why my data made no sense, I ended up diluting my primers down to 150nM and tried the rxn over again, and I got horrible data - no real curves - and a lot of jagged curves on my dissociation curves - all across the board. NOW, since the nanodrop is running, I know that I was adding around 300ng of template to my most concentrated rxn and around 3ng to the least concentrated.
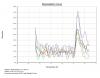
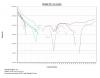
If you look at the images below, the nice looking curves are the rxns in which I had 150uM primers and the very crappy one was when I used 150nM primers. I hope that once I dilute my template down as well it may help the issue, since my protocol recommends 1-15ng of template cDNA and 50-900nM primers. Has anybody experienced anything like this? Thanks.
-Tony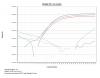
Suitable final concentrations for primers (unless it's for some extremely abundant target as 18S) are usualy within 300nM - 1uM (with 500nM as starting). Also 300 ng of template in reaction could be quite a a lot however measurement of cDNA concentration is not reliable (due to possibility of RNA-DNA duplexes and presence of RT reagents). So only RNA added to RT reaction is measured to get an idea how much you put inside. Generaly 1ug of pure DNAase-treated RNA is put into 20ul RT reaction and maximum of 2 ul is used in reaction.
I would double check the real concentration of your primers, first (from the very dilution).
Then I would check if you are calculating the final concentration right (i.e. the concentration in the reaction well, for example to get 500nM final concentration of a primer you will use 1ul of 10uM working stock in each well).
As for your results, the huge amount of nucleic acid in your first reaction may inhibited the most concentrated samples so they would have higer Cts than lower concentrated. But your primer differences are like 1000 fold, and 150nM shouldn't be that little, so the question about the correctly calculated primer concentrations is still in place.
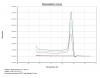
And, it is also much more usefull to post linear curve data images than logarithmic view, there is not much visible from it.