Need your help to find a solution for my problem to indicate significant differences in a bar chart plot. The data of the statistical test is available in the following format:
Bar1-bar2:significant
Bar1-bar3:not significant
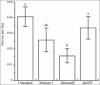
I want to mark significant differences between two bars with different letters (like bar1:a and bar2: b. If there is no significant differences between two bars they get the same letter (like bar1:a and bar3:a). Sort the right letters to the bars gets much more complex when the number of bars increases. I have several hundreds of statistical comparisons here and have to find a computer program that can generate the letters from the data for me.
Anybody an idea which programme can help me?
I have added an example plot with letter-coded significant differences to illustrate what I want to do.
*** If any one can help me to obtain a good reference material that guide to Interpretation and analysis of biological research data would be much grateful.
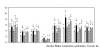
Attached a sample e.g.
-BIOAWY-
To my best knowledge, there is no such program that can automatically add letters, draw lines between comparisons. I do this in photoshop after pasting the bar figures from Excel. I am not sure whether R package can be of help if you have lots of figures to work with.
-pcrman-
Yes it becomes complicated, but not only for you but also for the reader....it would be a good idea to reduce the complexity in a way that a reader has a chance to get an idea about these results in reasonable time.
-hobglobin-