loss or results (ABI prism 7000) - (Nov/22/2012 )
Dear Guys,
I am new in PCR, I am using Bioapplied prism 7000
Today was my third repetition for the same experiment.
My first time, I was in a hurry, so closed the machine and program after finish without looking to the results. Next day, I did not find any good amplification plots, small irregular curves.
Ok I said it is my first time, lets repeat it again.
So I repeated it, again, the same experiment, after finish, I looked at the amplification plots and it was there, regarding melting curve it was fine not perfect but ok.
then I closed PC, and machine.
However, next day I did not find what I saw, no amplification plots at all, small irregular curves..
I asked my lab-mates if they faced a similar problem with that machine.
they said no.
SO I said ok, perhaps I am a little bit crazy,, but not to the delusions level, any way I would repeat it again.
Then I repeated the experiment today again.
I looked at the amplification plots and it were there for the tests.
Then close the program, ok, and reopen it, they are gone!!!!
small irregular curves are there only for tests.
Please I am gonna be mad,,, where are my curves??
does any one have a similar experience.
Did I miss something during machine preparation(I made my lab-mate track all my steps to set machine after second experiment)?? If I did not save my experiment, the machine will not start measuring.
what I do for analysis, I just select my wells in plate then click on results, and click on amplification plots and it is there??
Another thing, when I tried to see Standard curve I could not??? during my first observation, so there were good amplification plots but no standard curve at all.
after close and open, I use only 6 STD, how I can see 8 red points in standard curve??
please help me as I will be crazy????
when I close the exp, I said dont save, so it should be the original one??
is it possible that machine show me false results after the experiment?? but when I close program reopen, the result is true??
Please I need some opinion of this machine user
Please help or I will be mad, and I am already half mad today.
Madelin
it's ok Madelin...no need to go crazy over this, you just need to get a better grip on the use of the SDS software.  Were you able to open your saved data bec I didn't understand what you meant about the "small irregular curves are there only for tests..." and you're right, as long as you save your plate document (as a .sds file) before the run, your results are there. Besides, even if you forget to do this, the machine will prod you to save before it will proceed to run. I have used the ABI 7500 but it shldn't be so different. If you didn't save and export your results when you analyzed them immediately after the run, you probably need to analyse them again (green arrow on the tool bar > results tab > amplification plots, standard curve, dissociation etc subtabs) and don't forget to highlight all the wells that you want to view and choose the detector (if applicable). Just play with the software so you can get comfortable in using it....
Dear
casandra
I am very grateful for ur reply.
I ahve tried to play with my program.
However, I could not get the good graphs I saw before.
but it is better now
I have upload some photos that for my standard House keeping gene.
What I can see, that it is not good Rt-PCR data??
in dissociation curve, I can`t see one peak but several small peaks.
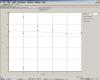
In Standard curve, I can see alot of red points?? what is this??? I am using only 6 samples, I should see six point even if my graph is not good.
what do u think??
If u have any comment please share it with me
Madelin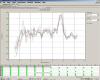
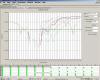
Can you post the raw data curve? This looks like you have low signal/no signal at all.
Trof on Tue Nov 27 09:32:13 2012 said:
Can you post the raw data curve? This looks like you have low signal/no signal at all.
yup, it looks like it but she said that she saw nice plots when she analysed immediately after the run....
@Madelin: can you post the plate subtab screen shot or the report for your GAPDH (so we'd be able to see the results- CT values, quantity, Tm etc)...re: standard curve- you have 6 points in duplicates? I don’t think the software can add more as long as you tasked correctly and input the corresponding quantity, dilution etc.
Dear Guys,
Thanks for ur nice and helpful suggestion.
I have upload the report for this standard.
Regarding STD curve, I have only 10 points??? not twelve, I used 6 samples, so in duplicate in should be 12, I can count 10 point only.
In my previous experiment, I could see 8 points only (not 6 or 12 or 10 like these).
Yes, I guess I have no good results at all, but this is standard, not test????
test looks like it
Thank u
Madelin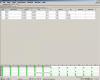
madelingirly on Wed Nov 28 23:05:38 2012 said:
Dear Guys,
Thanks for ur nice and helpful suggestion.
I have upload the report for this standard.
Regarding STD curve, I have only 10 points??? not twelve, I used 6 samples, so in duplicate in should be 12, I can count 10 point only.
In my previous experiment, I could see 8 points only (not 6 or 12 or 10 like these).
Yes, I guess I have no good results at all, but this is standard, not test????
test looks like it
Thank u
Madelin