Smaller band appear under Main product with every primers sets from PCR - (Jun/03/2012 )
Hej guys,
Im new to the forum and couldn't find the guidelines for posting, so hope I post according to "rules".
I have been doing qRT-PCR on 5 primer sets - p53, VEGF A, Cyclin A2, OAS1 and GAPDH. The primers were designed so they span two exons.
My problem is, that i get non-specific products in my samples as well as in some of the NTC. The weird thing is though, when run on agarose gel electrophoresis smaller bands than the main bands appear with all my primer sets.
The primers were optimized with regular PCR where the smaller bands didn't appear. This was done on different cDNA, so maybe it's the cDNA that's bad?
Do any of you know what might cause it?
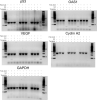
I have attached a picture of the gels with the PCR products.
DId you mean the less than 100 bp bands? or the shadow bands below your main band?
The <100 bp bands are primer dimers. The others may or may not be non-specific bands - do a melt curve to find out!
NitroAnna on Sun Jun 3 21:05:06 2012 said:
Hej guys,
Im new to the forum and couldn't find the guidelines for posting, so hope I post according to "rules".
I have been doing qRT-PCR on 5 primer sets - p53, VEGF A, Cyclin A2, OAS1 and GAPDH. The primers were designed so they span two exons.
My problem is, that i get non-specific products in my samples as well as in some of the NTC. The weird thing is though, when run on agarose gel electrophoresis smaller bands than the main bands appear with all my primer sets.
The primers were optimized with regular PCR where the smaller bands didn't appear. This was done on different cDNA, so maybe it's the cDNA that's bad?
Do any of you know what might cause it?
I have attached a picture of the gels with the PCR products.
I will suggest first run all of those samples of qRT PCR on gel. This will tell you what is actually happening with your samples/cDNA. I can see in gel there is more than one band. That means your primer is not optimized for RT-PCR.
If there is a possibility of primer dimer, you will be able to see that when you run your gel. To confirm that get dessociation plot/melt curve plot.
bob1 on Sun Jun 3 21:10:46 2012 said:
DId you mean the less than 100 bp bands? or the shadow bands below your main band?
The <100 bp bands are primer dimers. The others may or may not be non-specific bands - do a melt curve to find out!
Im wondering what the shadow bands are.. I think it's weird that they appear under all the main bands. So if there are multiple peaks in my melt curve it's non-specific bands? and if these peaks aren't present in the NTC's, it could be from a secondary primer target in the genome? I just find it strange that all the primers would have a secondary target thats only a little bit smaller than the main band.