Interpreting Nanodrop results - (Mar/23/2012 )
Hi all
I know that might sound a little awkward to ask about such a basic thing but I was just wondering whether I can rely on nanodrop data. I have got very good 260/280, somewhat acceptable 260/230 (lower than recommended range but still this does not worry me because the downstream application might not be affected by this much). The graphs I get are OK but not like the one everybody WANTS them to be when doing nanodrop. I am uploading a pic with that for you people to see.
My question, whether I can rely on this data or not? Specially when the graphs show peak at 260, they are bell shaped but not that much high as you expect them to be....
oops i forgot to add the file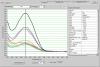
There's nothing wrong with them, you have a little organic solvent contamination, but nothing too bad.