Primer validation and PCR efficiency - (Dec/06/2011 )
Hi all!
I run to a problem with primer validation. I'm working on that over a two weeks now and I'm getting frustrated, because my time and money are slowly running out. I've got to validate 3 reference genes and 5 (for now) GOI.
Background info:
RNA: I've isolated RNA from fish skin with RNeasy Lipid Tissue Mini Kit (Qiagen) and checked it on Agilent (RINs between 8.5-9.5). Concentration was measured on NanoDrop.
cDNA: I've used 2 ug of RNA, treated with DNase and synthesised it with SuperScript VILO cDNA Synthesis Kit (Invitrogen).
qRT-PCR: I've made 5 series of 4-fold dilutions (from 125 ng to 488 pg RNA). I'm using SYBR GreenER from Invitrogen. Reaction volume: 10 ul
GOI-A: primers final concentration 400 nM, annealing temp.: 60°C, Ct's from 21 to 28. If you look to a picture of melting curve of GOI-A,  you'll see that there are some unspecific products (blue and red line) in first two dilutions (125 ng (blue) and 31.25 ng (red)). Efficiency: 122.3%, R^2: 0.992. There is also gel picture
 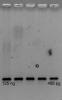 and in first two dilutions smear appears. When I excluded those two dilutions, efficiency was 147% and R^2: 0.984.
  I don't understand why efficiency gets higher? Then I thought maybe there are some inhibitors involved. So I used only last two dilutions (1.95 ng and 488 pg), efficiency lowered to 115.8%, R^2:0.973. Is that mean that there are some inhibitors involved?
  But if I understand efficiency-efficiency lower than 90% indicates inhibitors and efficiency higher than 110% indicates unspecific products, primer dimers or pipetting error. My melting curve doesn't show unspecific product (when first two dilution are excluded) then why efficiency jumps to 147? Am I really so bad with pipetting
  How to solve this?
Then there is second GOI-B. When I tried to validate primers with same dilution series, Ct's occurred only in first two dilutions (125 ng and 31.25 ng), higher dilutions showed no amplification . How to solve that? Is it possible to use one dilution for one GOI and another dilution for second GOI?
I hate validation . Could you share with me, how long and how tricky can primer validation be? What to do if you don't have to much time or resources to spare? I don't know if I'm doing something wrong here
Help me out, please  What are the steps/recipe for successful primer validation?
Urska
What were the Cts in your reaction for GOI-B? It's possible to use different dilution for different genes, if you need it for efficiency calculation, depends on abundancy. How exactly you dilute your samples?
For GOI-B Cts were higher than 35. I've diluted my cDNA 1:4, 1:16, 1:64, 1:256, 1:1024 and 1:4096. For validation I used dilutions from 1:16 to 1:4096. I didn't use 1:4 dilution (500 ng RNA), because I think this is too much template for qRT-PCR.
Dilutions:
1:16 16 ul 1:4 cDNA + 48 ul water
1:64 16 ul 1:16 cDNA + 48 ul water
1:256 16 ul 1:64 cDNA + 48 ul water
etc.
Is it not true that with dilution series you also get an answer which dilution you'll use for relative quantification of GOI? Or to put it other way around. How do you know which dilution to use in relative quantification of GOIs? I'm asking this because if GOI-A amplifies, for example, in 1:16 (lower dilutions result in no amplification) and GOI-B amplifies only in 1:2, what can you do to solve this problem?
Urska
In my experience you need to use "concentrated" standards to get an efficiency less than 100%. Typically, I run a qPCR in my SYBR green master mix to generate the product, purify it with Qiaquick, then dilute it 1:10, 1:100, 1:1000.....
Almost without fail the standards that give a really nice straight standard curve (R2=1, and efficiency less than 100%) are 1:100, 1:1000, 1:10000, and 1:100000. If I try to use the next 2 or three dilutions, the curve slants to greater than 100%.
doxorubicin on Tue Dec 6 20:23:02 2011 said:
In my experience you need to use "concentrated" standards to get an efficiency less than 100%. Typically, I run a qPCR in my SYBR green master mix to generate the product, purify it with Qiaquick, then dilute it 1:10, 1:100, 1:1000.....
Almost without fail the standards that give a really nice straight standard curve (R2=1, and efficiency less than 100%) are 1:100, 1:1000, 1:10000, and 1:100000. If I try to use the next 2 or three dilutions, the curve slants to greater than 100%.
But I used more "concentrated" standards than you do. I used 1:16, 1:64, 1:256, 1:1024 and 1:4096. Well I can try to do 10-fold dilution series like you, but I'm a little sceptic if that will work. I don't see why it should work better than current dilution series
