Primer efficiency - How to determine primer efficiency correctly? (Jul/12/2010 )
Hi all,
I'm quite new to the RT-PCR field, and for my internship I have to do a couple of RT-PCR experiments using SYBR green. I've read a couple of documents about it and it seems that validating the primers is very important however, it is not totally clear to me yet.
For instance: Since I have multiple knockdowns of a cell type, should I make a standard curve of each of those knockdowns? Or is testing the primers on the Wildtype cell line enough?
Also, should the forward and reverse primer be tested seperately or in the same well?
Concerning the plate lay-out: I was thinking of doing the standard curves in triplicates (5 log dilutions) and taking along a H2O sample for each primer to test for primer dimers. Is that enough or should I take other controls into account?
Thanks in advance! 
Aloys86
Since the efficiency of the primers should be the same for all similar templates, using just wildtype for the construction of standard curve should do it.
I don't understand how you want to test primers separately, PCR product is created only when both forward AND reverse primer are in the reaction.
Making five log-dilutions in triplicates should be fine, non-template control (H2O sample) is a necessity to check contamination, you can usualy see primer-dimers in each well if you do a melting curve at the end of the reaction (and dimers in the non-template control may not matter, if they're not present in the samples, it can happen sometimes). If you're using reverse transcribed RNA as a template, you may want to make RT- control (sample prepared as other samples but without reverse transcriptase) to check for gDNA contamination.
Thanks for your helpfull reaction!
About the separate testing of the primers, i thought it might be possible that somehow only one of the two primers could work correctly and the other one does not. Therefore you might want to test them individually, but indeed since you need both primers to get amplification, you cant measure them separately.
Today I made my standard curves and there are a few issues which I don't understand.
In the attached picture, the Ct curves dont start at the same Rn (y-axis) value, why is that and is it a problem?
Also, when calculating my E values, and take the Ct of the highest concentration (1) into account the standard curve is messed up. However, when I exclude the highest concentrations from all my standard curves they have a r2 value of > 0,98. So whats happening here? Is the cDNA concentration too high? And is it inappropriate to exclude the highest value from the curve?
Moreover, excluding (1) from my standard curves gives me E values of approximately 110%. Is this bad, considering the general rule is max 105%?
Thanks in advance!
Aloys86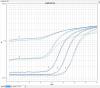
Yes, standards 1 and 2 have very high amount of template, high Rn value can be result of this. There is so much DNA that it fluoresce on it's own, that lowers the obtainable difference between starting template and newly created product and that makes problem with calculating the Ct.
I personaly would exclude both of them from the standard curve. You can have standard curve with 3 points only, but perhaps it'll be better to make more diluted standards. Generaly Ct's lower than 15 should't be obtained, not in the standard curve nor the sample, such values aren't quantitable. It is possible that the curve number 2 is skewing your efficiency, since high efficiency values can mean there is inhibition in the more concentrated standards (that too can be the result of too high DNA concentration).