Standard curves, are they necessary every time we run an experiment? - (Jun/02/2010 )
Hi,
I have done a couple of Real-Time PCRs and I still do not have something clear. I would appreciated if someone can help me.
I study relative expression of a particular gene under two different conditions. Is it necessary to run a standard curve every time a run my samples? Why does the efficiency of my run change (from 115% efficiency to 85%) when I remove one point of the standard curve, without moving the threshold?
Thank you so much!
BTC
no, this is not necessary but you should only use "high quality" standard curves for your efficiency calculations. that means, at least five dilution points measured in triplicates, a high dilution range (5 to 6 logs), with efficiencies between 90 to 105%, and an r² of >0.99.
And your experimental samples should always lie within the range of the standard curve.
A picture of your std curve would be helpful to answer your second question.
tea-test on Jun 3 2010, 06:21 AM said:
And your experimental samples should always lie within the range of the standard curve.
A picture of your std curve would be helpful to answer your second question.
Dear tea-test,
Thanks a lot! Even if I am studying different genes expression under different conditions, can I apply the same standard curve?
The efficiency actually goes from 103% to 85%, I just attached a picture of it. My doubt is the following: if efficiency measure exponential amplification of my samples, how can the amplification change by removing one sample?
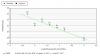
Because if one point totally falls out of the range it can significantly alter the slope of the curve from which the efficiency is calculated. you can see also the bad r² value of 0.87. such a curve should not be used for analysis.
I assume its the G1 point that distorts your std curve. Now you have 103% but if you remove it the efficiency drops to 85%? that because without the G1 point the curve gets steeper and that means you need more cycles (displayed on the y-axis) to amplify your DNA in the same time period, hence a worse efficiency. I would say that there was obviously something wrong with the sample in G1.
another suggestion: use a higher dilution range for reproducible standard curves, the lower the dilution range the higher the variation of efficiency.
concerning std curves with different experimental settings: currently the efficiency of an assay is considered to be assay dependent and not sample dependent. that means, the performance of the assay depends on the sequence of your primers (and probes). to my knowledge there is no reliable routine method available to measure sample specific PCR efficiency during a real time PCR run.
So, I would say you can use the same std curve for calculations of samples derived from different experimentals settings as long as you are using the same primers(!) and reagents. If you are changing your reagent supplier or the instrument you should do the std curves again.
tea-test on Jun 3 2010, 01:17 PM said:
I assume its the G1 point that distorts your std curve. Now you have 103% but if you remove it the efficiency drops to 85%? that because without the G1 point the curve gets steeper and that means you need more cycles (displayed on the y-axis) to amplify your DNA in the same time period, hence a worse efficiency. I would say that there was obviously something wrong with the sample in G1.
another suggestion: use a higher dilution range for reproducible standard curves, the lower the dilution range the higher the variation of efficiency.
concerning std curves with different experimental settings: currently the efficiency of an assay is considered to be assay dependent and not sample dependent. that means, the performance of the assay depends on the sequence of your primers (and probes). to my knowledge there is no reliable routine method available to measure sample specific PCR efficiency during a real time PCR run.
So, I would say you can use the same std curve for calculations of samples derived from different experimentals settings as long as you are using the same primers(!) and reagents. If you are changing your reagent supplier or the instrument you should do the std curves again.
Hi tea-test,
That´s right when I remove the sample G1 the efficiency drops to 85%.
What do you mean by a higher dilution range for my standard curves? I do them with cDNA.
Have you notice that two experiments, even with the experimental samples, do not have the same efficiency? What do you think about this? even if you get a really good r2 value (i.e 0.998 or 0.997).
Thanks again.
Hi, to get a high reproducibility for your std curves you should always aim for a broad dilution range. unless your targets genes are not highly expressed this can be a problem when using cDNA. what you can do: use cDNA from a source that is highly expressing your target like a transfected cell line, use plasmid DNA with your inserted target sequence, or use the purified PCR product from a previous run as standard (maybe the most simple way). If you choose the second or third approach be very careful not to contaminate your experimental samples or reagents. for instance, do the std curve preparation at a different place and keep a set of pipettes which you only use for PCR/qPCR.
I have attached a document which explains the relationship between dilution range and variation of efficiency.

tea-test on Jun 4 2010, 11:38 AM said:
I have attached a document which explains the relationship between dilution range and variation of efficiency.
Dear tea-test
Thank you very much!
The .pdf is really helpfull.
Take care.