High Amplification Efficiency in Std. Curve - (May/05/2010 )
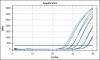
I ran two standard curves with my primer set and hydrolysis probe (FAM and BHQ1) with undiluted cDNA, 1:10, 1:100, 1:1000 and 1:10000. I used 0.4 uM primers and 0.2 uM probe for my first curve. The amplification efficiency was 139.6%! Yikes! I have read that this indicates that I have PCR inhibitors, but how is this the case? My amplification curve is very steep and never reaches a plateau by 40 cycles. Is my probe just getting chewed up in my reaction? I am using iQ supermix so the buffer already has an optimized concentration of dNTPs and Mg2+, however I can add additional Mg2+. Should I play around with Mg concentrations? The amplification efficiency of my second std. curve was 129%. I used 0.3 uM primers and 0.15 uM probe. The amp curve still never reached a plateau and was steep. I validated my primers using a SYBR green assay before I ordered my probe as suggested by Bio-Rad. The melt curve indicates no non-specific stuff and I successfully sequenced my product. Can anyone give me insight into what the heck is going on? Thanks!
Can you upload an image of your std. curve? The fact that you are not reaching a plateau is strange, something must be going wrong.
Aren't your Ct cycles used for std. curve construction too late? If it starts after 25 it is wrong and you will never have a good curve. You have to do PCR first on your cDNA and then use this purified PCR product for standard curve construction.
Standard Curve 1
Standard Curve 2
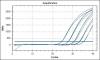
Yes, exactly as I said - your Ct cycles are too late. You have to PCR-amplify your qPCR target, purify that PCR product and use it for new standard curve. Your curve should start between 10 - 20 cycle.
vladooo on May 6 2010, 12:25 AM said:
I'm doing relative gene quantification. I don't think that I want to purify my PCR product, etc. My understanding is that whatever I'm using as my template in my assay is what should be used to construct my std. curve. In this case it is cDNA.
ColoSarah on May 6 2010, 01:10 AM said:
undiluted cDNA ? so how much is ur RNA at the very first place? maybe u can try increase the concentration of template using...