qPCR determination of phage numbers - slope difference for different phage clones (Dec/02/2009 )
Hi all,
I am using Sybr Green qPCR to determine the phage concentration from my phage display experiments. The problem I have is that even though the qPCR results show good linearity from multiple measurments (R2>0,995), the Ct vs. dilution slope is very different for different phage clones. The amplicon I am measuring is the same for all clones. I prepared 10-fold serial dilutions of three phage clones from three different phage display libraries. I measured Cts for all dilutions in triplicate and plotted the Cts vs the dilution. There is good linearity for each clone, and the Ct values measured do not vary much, however the slopes of the lines are very different for each phage clone. Can anyone explain how the efficiency of amplification of the same amplicon (in the same run) can be different for different phage clones? The clones differ only in the insert that codes for the displayed protein (some 50-150 bp in a phage genome of 37000 bp).
Thanks for the help, it will be greatly appreciated.
Cheers,
Miha
hi BM... what exactly do u mean by lot of difference in the slope?? aer u saying one is 3.3 and the other is 2.3?? that is more!!
also another measure to see if this is actually affecting the linearity is to calculate the percent recovery of the standard values by back calculating from the graph. That will give u the true variation. Only the R2 wont give u the information.
Can you provide two sample graphs which u think are way apart in slopes with the values?? or else calculate for yourself and see!!
Three different libraries means three different quantitation. you hacve to account for these errors too!!!
Pradeep Iyer on Dec 2 2009, 10:07 AM said:
also another measure to see if this is actually affecting the linearity is to calculate the percent recovery of the standard values by back calculating from the graph. That will give u the true variation. Only the R2 wont give u the information.
Can you provide two sample graphs which u think are way apart in slopes with the values?? or else calculate for yourself and see!!
Three different libraries means three different quantitation. you hacve to account for these errors too!!!
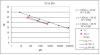
This is the rough Excel plot. Because Excel won't let me plot the trendlines in log they are in ln. If I calculate the coefficients of the slope in log, they are:
3.86
4.18 and
3.42
Is that normal or out of the ordinary.
Also the amplicon is the same for all clones, so the quantitation should be the same.
Thanks for the help.
Regards,
BioMiha