Noise in ChIP-Chip data - If it's repeatable, is it noise? (Oct/19/2009 )
Hello all,
I'm struggling to make sense of my ChIP-Chip visual data. Let me precede all of this by saying I've done numerous controls and tests at the sonication, IP, and array steps, all of which appear to give me accurate data. However, when I visualize the final ChIP-Chip data, it appears that there are too many jagged peaks throughout the genome, including some large, wide positive and negative peaks. Still, there are also some textbook ChIP-Chip peaks there as well.
But here's the kicker - I've done three completely separate biological replicates from culture to array and get the same results, i.e., similar peaks between each array (even those positive and negative peaks that don't look quite right). So if the data is repeatable, is it really noise? Or is it indicative of actual binding? I have read that noise can contaminate an array data set and give false peaks, but also that there is the 'appearance' of noise when evaluating global repressors, and that it's actually correct data.
Specs: I'm evaluating a repressor protein in E coli using Nimblegen K-12 WG microarrays.
I don't have the experience with ChIP-Chip data to make final conclusions about this data, so any help from any of you who may have seen this sort of thing before is greatly appreciated. I've attached a small (~90kbp segment of the genome) pic of the three replicates so you can see the repeatability. Note that this is raw data, before the peak-finding algorithm is applied.
Thanks!
Chris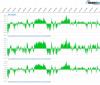
Hi Chris,
Have you tried qPCR to determine if the 'peak areas' are trully enriched in your IP compared to your IgG/Input?
Clare
chrismbyrd on Oct 19 2009, 03:37 PM said:
I'm struggling to make sense of my ChIP-Chip visual data. Let me precede all of this by saying I've done numerous controls and tests at the sonication, IP, and array steps, all of which appear to give me accurate data. However, when I visualize the final ChIP-Chip data, it appears that there are too many jagged peaks throughout the genome, including some large, wide positive and negative peaks. Still, there are also some textbook ChIP-Chip peaks there as well.
But here's the kicker - I've done three completely separate biological replicates from culture to array and get the same results, i.e., similar peaks between each array (even those positive and negative peaks that don't look quite right). So if the data is repeatable, is it really noise? Or is it indicative of actual binding? I have read that noise can contaminate an array data set and give false peaks, but also that there is the 'appearance' of noise when evaluating global repressors, and that it's actually correct data.
Specs: I'm evaluating a repressor protein in E coli using Nimblegen K-12 WG microarrays.
I don't have the experience with ChIP-Chip data to make final conclusions about this data, so any help from any of you who may have seen this sort of thing before is greatly appreciated. I've attached a small (~90kbp segment of the genome) pic of the three replicates so you can see the repeatability. Note that this is raw data, before the peak-finding algorithm is applied.
Thanks!
Chris
Hi Clare - yes I've done qPCR on several different sites, and I think that the peak data is a pretty accurate representation of what actually exists in the IP. And, again, this is three completely separate biological replicates of the same DNA-binding protein. So I suppose I'm really concerned that there's something screwy in the IP that's resulting in all of these erratic peaks. The one consolation of all of this is that my single positive control (only place it's currently known to bind) does show up as a peak. BUT, in a ChIP-Chip I know that both real and false peaks can be of the same magnitude.
Let me also say that this protein is a finicky S.O.B. and doesn't want to play nice in gel-shift assays. I'm working on in vivo expression assays to help solve this, but would still love to hear from others about that peak data...
Chris
How is your array designed? Does it cover the whole genome and contains repeat regions? The additional peaks may arise from crosshybridization of your DNA to repeat regions of the genome?