less steep curve and high Ct value! - (Sep/09/2009 )

some problems are met , i'm eager to get your help!
Total RNA are verified by gel check and spectormeter, and 1ug Total RNA are digested by DNase I (Fermentas), in a total 10ul volume. and then 5ul treated RNA are added in the RT reaction, 50 ul volume, (Taqman RT, ABI), and then diluted 5 as RNA preparation solution (2ng/ul). use SYBR green master mix (abi) to perform PCR, in a total of 8ul volume, in which RNA preparation solution are added 2ul .
qPCR instrument ABI 7900HT, universal 18s primers are used as reference gene, there are 20 samples .
after qPCR, part of the amplification plots are less steep and high Ct value, I don't why , and puzzled what to do next step?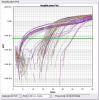
Hi,
It seems to me the expression is extremely high in part of your samples.
Have you adjusted the baseline? Try setting the baseline stop to 2 and see if the curve looks better then.
After that you might need to adjust the threshold too. Try setting it so that it crosses the the linear part of all the curves.
The few lines that are almost linear (have no S shape at all) are most likely primer-dimers in NTC.
Good luck!
Ytje
Thanks! I am going to try adjust