Help reading/identifying part of a FCM chart. - (Nov/13/2011 )
Can anyone help me identify what the different peaks mean in terms of cell cycle?
I know that the first peak belongs to the G1/S phase but what does the 2 medium peaks represent (from the first graph at hour 3)?
Graph taken from https://www.nature.co...ature09097.html
Thanks
EDIT: Does the 2 medium peak mean it's at the G2/M phase?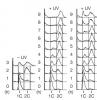
Well, according to the figure, they're labeling the first peak as 1C (i.e. 1 copy of DNA a.k.a. G1 cells) and the second peak as 2C (i.e. 2 copies of DNA a.k.a. G2/M cells). I'm sort of surprised this figure is published in Nature, as the staining looks really bad. Cell Cycle peaks are typically very sharp, whilst these peaks are very broad. This is usually the result of poor fixation or insufficient staining concentration/duration.